Welcome to the 2012 Tropical Storm season!
Scroll down for a variety of images.
CLICK HERE FOR THE LATEST ADVISORIES FROM NHC/TPC/NOAA
This comes direct from the NOAA Datastream and should load up FAST! Don't forget to come back when you're done reading the advisories!

Alternate map from TPC/NHC - NOTE: THIS IS A MARINE USE MAP
The "Danger Area" areas thar are noted are for rough seas/high waves from any storms plotted.
The normal area of high winds and heavy precipitation would be closer to the storm itself.
Backup Version from Weather Underground:

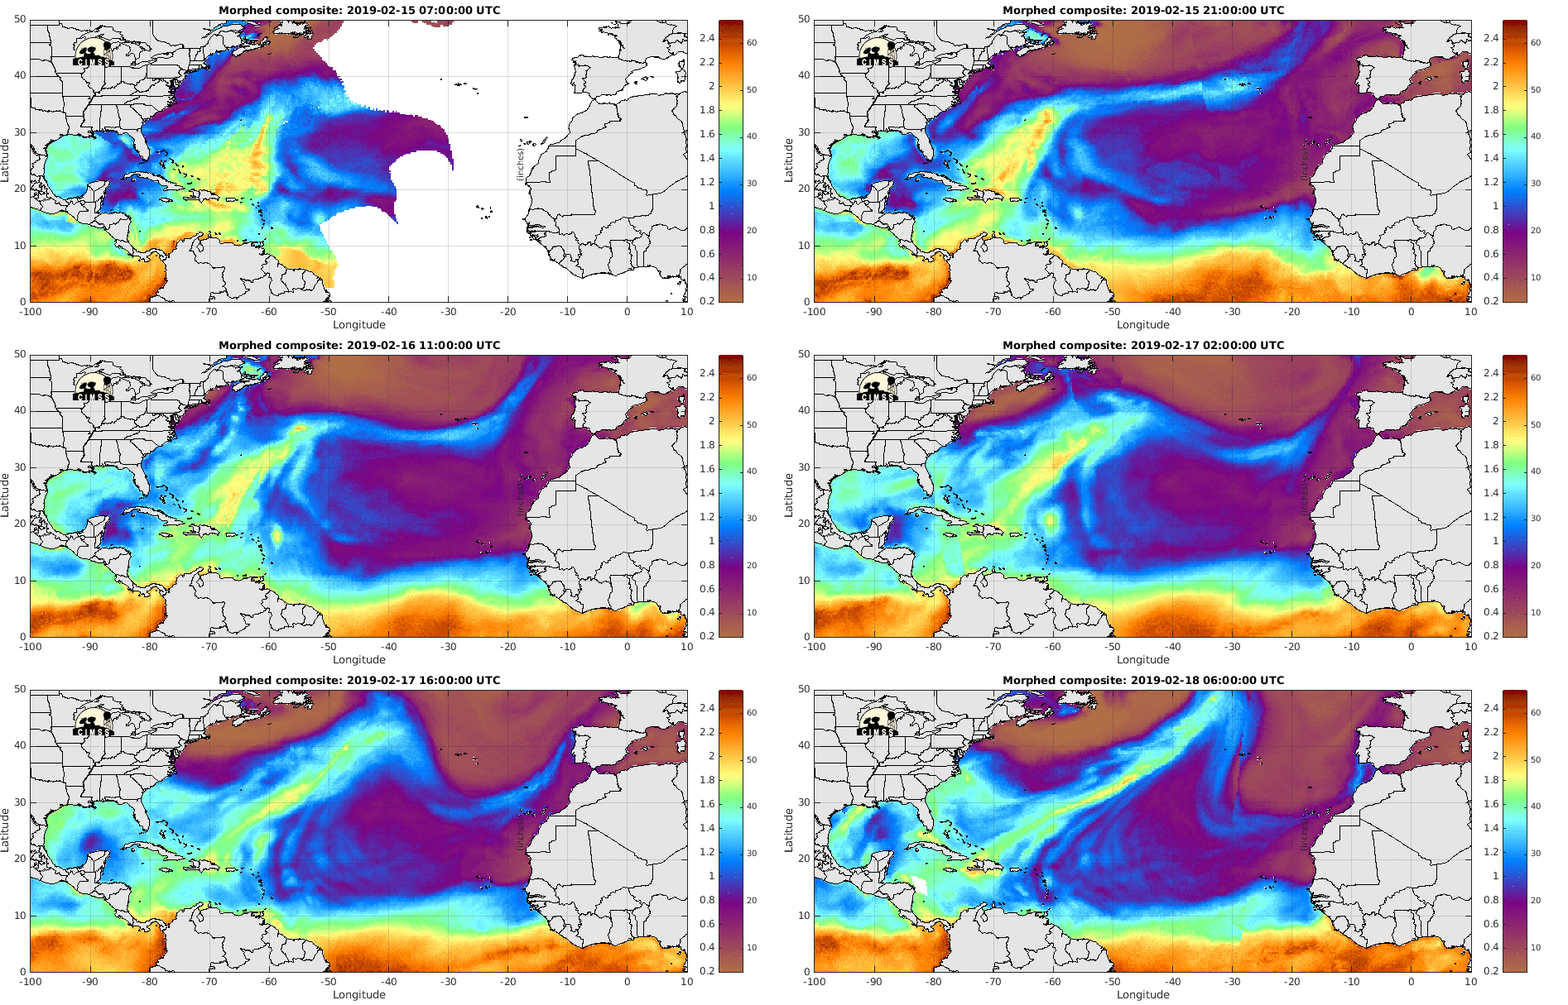
Super cool MORPHED 72 HR Precipitable Water of Atlantic Basin

Current Tropical Floater Sector Closeup (Subject to change on a daily basis for any significant weather.)
Visible
Infrared
Other Active Floater Sector Images Following Current Storms (Closeups)


The Current West Tropical Atlantic Visible Satellite Image
Eastern US/Atlantic Coastal Visible Image:
Same Image in infrared below:
A Different Perspective Visible Image:

Water Vapor IR in color

Entire north Atlantic basin

Polar View IR

And finally, the Water Vapor image from above perspective:

Page updated...5/25/12 bwx